Tuesday, 18 October 2016

There is no remote user ‘xxxxx’ mapped to local user ‘(null)’ from the remote server ‘xxxxx’

My Client recently complained that his linked server was failing to connect with the following error,

“An error Occurred during Service Key decryption
There is no remote user ‘xxxxx’ mapped to local user ‘(null)’ from the remote server ‘xxxxx’.
(Microsoft SQL Server, Error : 33094)”

On checking the user permissions were right and the remote login in which the Log server was configured had right permissions to access to the Linked server.

When I did some googling I stumbled across, https://technet.microsoft.com/en-us/library/ms187788.aspx

To change the SQL Server service account, use SQL Server Configuration Manager. To manage a change of the service account, SQL Server stores a redundant copy of the service master key protected by the machine account that has the necessary permissions granted to the SQL Server service group. If the computer is rebuilt, the same domain user that was previously used by the service account can recover the service master key. This does not work with local accounts or the Local System, Local Service, or Network Service accounts. When you are moving SQL Server to another computer, migrate the service master key by using backup and restore.

The REGENERATE phrase regenerates the service master key. When the service master key is regenerated, SQL Server decrypts all the keys that have been encrypted with it, and then encrypts them with the new service master key. This is a resource-intensive operation. You should schedule this operation during a period of low demand, unless the key has been compromised. If any one of the decryptions fail, the whole statement fails.

The FORCE option causes the key regeneration process to continue even if the process cannot retrieve the current master key, or cannot decrypt all the private keys that are encrypted with it. Use FORCE only if regeneration fails and you cannot restore the service master key by using the RESTORE SERVICE MASTER KEY statement.”

This is exactly what happened with my client, the SQL was running under local account and the server was migrated.

Once I ran ALTER SERVICE MASTER KEY FORCE REGENERATE the linked servers started working gain.


Thursday, 25 August 2016

SQL Server 2016: SQLServer Powershell Module and Get-SQLErrorlog CMDLET

With the latest update to SQL Server 2016 SSMS there are some new interesting features added to the SQL Server Powershell making managing SQL Server through Powershell more easier and efficient.

The Detailed information on the addition can be found in the below link,

https://blogs.technet.microsoft.com/dataplatforminsider/2016/06/30/sql-powershell-july-2016-update/

In this blog we are going to see how we can add this new module to our existing software and we are going to look at one interesting CMDLET "Get-SQLErrorlog"

Lets get started with updating the SSMS, Download the latest SSMS from the below link irrespective of if you want to install a new instance of SSMS or upgrade the existing instance
https://msdn.microsoft.com/en-us/library/mt238290.aspx


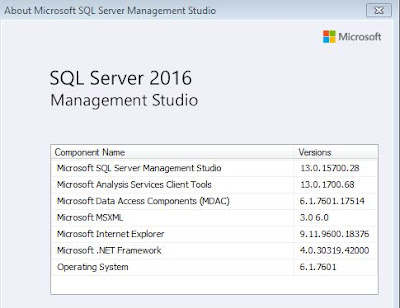
The Install or upgrade should be pretty straight forward, once the installation is complete verify your SSMS Version 13.0.15700.xx and above will have the new SQL Server module.


As mentioned in the Above SQL Server Team Blog (https://blogs.technet.microsoft.com/dataplatforminsider/2016/06/30/sql-powershell-july-2016-update/)

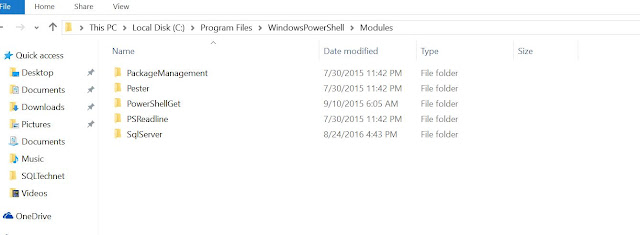
"The SQL PowerShell module that ships with SSMS has changed from SQLPS to SqlServer (there is no change to the module used by SQL Agent). This means that if you have a PowerShell script doing Import-Module SQLPS, it will need to be changed to be Import-Module SqlServer in order to take advantage of the new provider functionality and new CMDLETs. The new module will be installed to “%Program Files\WindowsPowerShell\Modules\SqlServer” and hence no update to $env:PSModulePath is required"

So Now lets go and check if the SSMS update has installed the new module


There you go, Now we have the new SQLServer Module installed, Let check it out as i mentioned before I am going use Get-SQLErrorlog CMDLET in the SQLServer Module for the testing

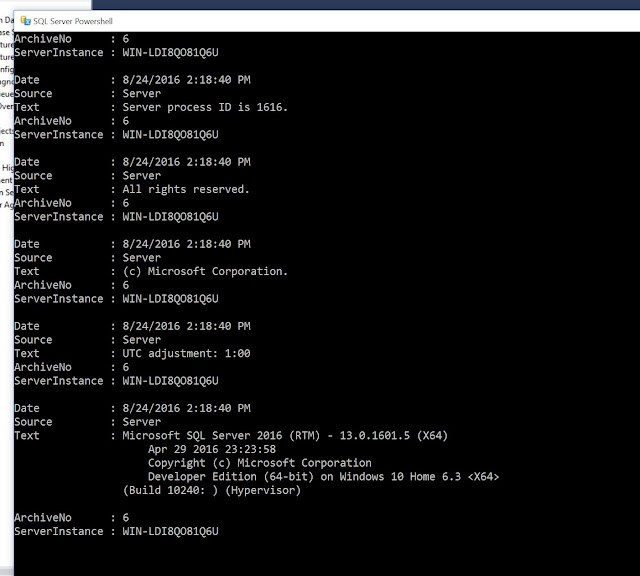
More about Get-SQLErrorlog @ https://technet.microsoft.com/en-us/library/mt759806.aspx


There you Go...We can get the errorlog as simple as that!


Now Let see how we can play with it on Powershell Console, I use PowerGUI as my powershell editor but you can use Windows native editor or any other 3rd party editors for Powershell,

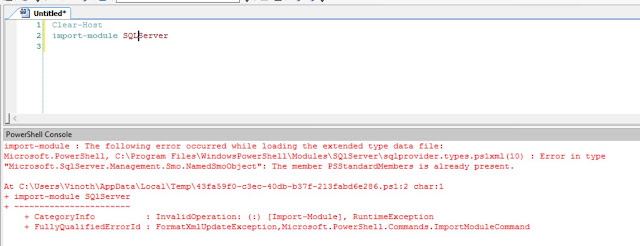
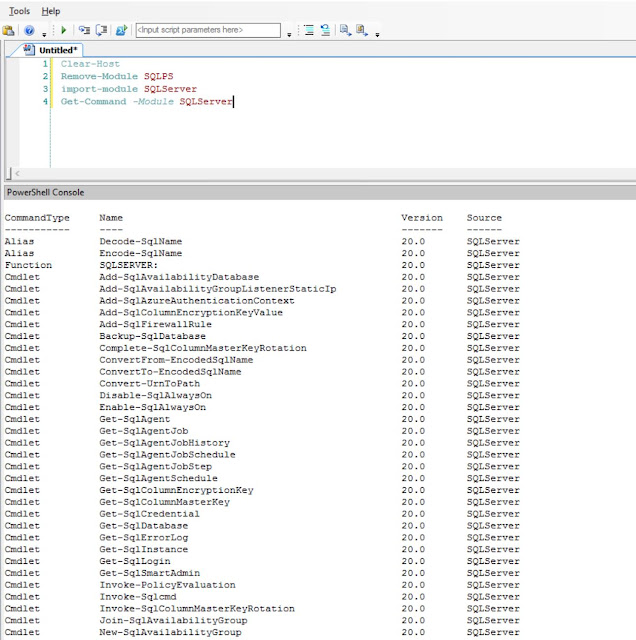
As a First step I try to Import the new module SQLServer but it throws an error as shown in the below image, this is because most of you would have SQLPS module already loaded in the PSenvironment which conflicts with the SQLServer module.


All you need to do now is remove the SQLPS module and add the new SQLServer module as shown in the below image, you can now see the new CMDLETS in the SQLServer module which you can now work with.


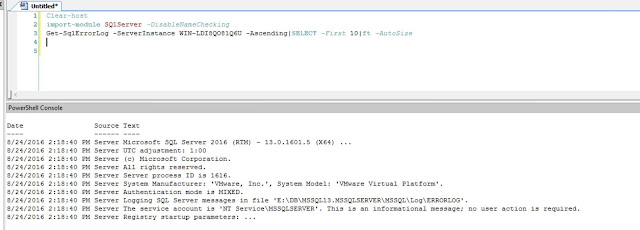
Ok, Now I want to select first 10 rows from my SQL Server errorlog, lets see how it can done using powershell...


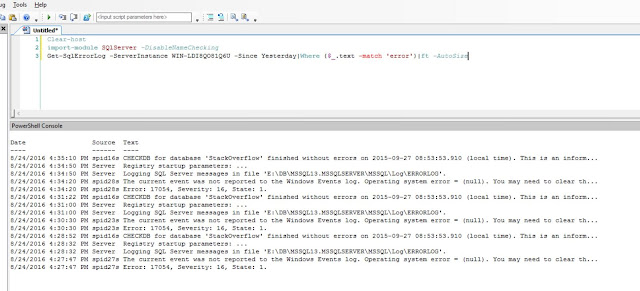
Last I want to see all the errors in my errorlog last 24 hours, lets see how we can do it,


We can now monitor SQL errorlog in various ways using powershell with this new CMDLET.
In further articles we can see how we can use other CMDLETS in the new Powershell SQLServer module.


Tuesday, 21 June 2016

SQL Server 2016 SSMS

With the official release of SQL Server 2016 this month let’s try out what is new in SSMS 2016 and how we can access the new 2016 features via SSMS,

To Start with the SSMS is now a separate component and does not come with SQL DB engine install as in earlier versions.


As you can see in the above figure all the client components needs to be installed separately and does not come with the DB engine anymore, when you move on to the features page on the install it no more gives us the option of the client components.


The install of SSMS and other client components are straight forward I would not like to go into details of the install anymore. Let’s try some new features of SSMS  

1) Pin your solution screen, This is a big relief now you don’t need to search for your primary query window when you have multiple query windows are open, you can pin a query window and then work around it, the pinned window will never move out of your working space.


2) Although not entirely a SSMS concept but with the introduction of live query stats you have option to select include “Live Query Statistics” near the Include execution Plan option in SSMA(Shown in the pic below) More on Live Query statistics https://msdn.microsoft.com/en-us/library/dn831878.aspx 


3) Another new and what i think is the most interesting concept introduced in SQL Server 2016 is Query Store can be found in database properties window now, we can discuss the Query store in detail in a separate blog.(More Info:- https://msdn.microsoft.com/en-GB/library/dn817826.aspx)


4) Row level security:- RLS is another new concept for more granular security at the row level introduced in SQL 2016.(More Info:- https://msdn.microsoft.com/en-us/library/dn765131.aspx )
You can create RLS via SSMS through Databases->Security->Security Policies folder as shown below.


5) Finally you have the new Polybase concept to query non relational data stored in Hadoop or Azure Blob storage(More Info:- https://msdn.microsoft.com/en-us/library/mt143171.aspx )
You can access this via polybase folder in the SSMS as below.


In in the coming blog we will discuss each one of these new concepts in detail.

From 2016 the SQL Server developer edition has beed made free, please download and make use of it. you get all enterprise features for testing absolutely free now!!!


Thursday, 24 March 2016

NUMA Nodes and SQL Scheduler Configuration Performance Impact


I recently built a new SQL server for one of my client with 72 cores, It was an SQL 2014 enterprise edition and was an upgrade from Amazon Web services to Physical infrastructure with higher processing power, Memory and faster disk. The SQL Version was the same (SQL 2014 SP1 on AWS and Physical Infrastructure) but surprising the physical infrastructure was slower than AWS in some instances. Some queries were taking long time in the new server and waits pointed to CPU Schedulers.

Thanks to our Performance Auditors(Mike Walsh from Linchpin People) who found out the following message from the SQL error log,

“SQL Server detected 2 sockets with 18 cores per socket and 36 logical processors per socket, 72 total logical processors; using 40 logical processors based on SQL Server licensing. This is an informational message; no user action is required.”

We found the client was licenced SQL for only 40 cores even though the hardware had 72 cores SQL can use only the licenced 40 cores. This was still an non-issue as this was still more processing power to AWS and that’s when Mike pointed me to Glenn Berry's Blog http://www.sqlskills.com/blogs/glenn/balancing-your-available-sql-server-core-licenses-evenly-across-numa-nodes/

As mention in the above blog post, I ran

-- SQL Server NUMA node information
SELECT node_id, node_state_desc, memory_node_id, processor_group, online_scheduler_count
FROM sys.dm_os_nodes WITH (NOLOCK)
WHERE node_state_desc <> N'ONLINE DAC' OPTION (RECOMPILE);


node_id
node_state_desc
memory_node_id
processor_group
online_scheduler_count
0
ONLINE
0
0
36
1
ONLINE
1
1
4

As you can see in the above result,  36 Schedulers are in use on the first NUMA node with the first 36 logical processors and then 4 are in use on the second NUMA node. This is not an optimal configuration If we have had SQL licensed for all the 72 cores we would have had equal balance with the schedulers on the NUMA nodes. This might be a performance bottleneck.

I followed Glenn's blog again and ran

-- SQL Server NUMA node and cpu_id information
SELECT parent_node_id, scheduler_id, cpu_id
FROM sys.dm_os_schedulers WITH (NOLOCK)
WHERE [status] = N'VISIBLE ONLINE';

From the above query result I found the cpu id’s in use were from 0 to 19 and 64 to 83 after which I ran the below ALTER query as suggested in the blog with right CPU id.

ALTER SERVER CONFIGURATION
SET PROCESS AFFINITY CPU = 0 TO 19, 64 TO 83;

Now I ran first query again to find NUMA node information,

-- SQL Server NUMA node information
SELECT node_id, node_state_desc, memory_node_id, processor_group, online_scheduler_count
FROM sys.dm_os_nodes WITH (NOLOCK)
WHERE node_state_desc <> N'ONLINE DAC' OPTION (RECOMPILE);

node_id
node_state_desc
memory_node_id
processor_group
online_scheduler_count
active_worker_count
0
ONLINE
0
0
20
41
1
ONLINE
1
1
20
56


As you can see now we reached a balance now with CPU schedulers and the NUMA nodes. This change resolved our slowness issue and the server is now much faster than our lower hardware system.

Friday, 15 January 2016

Interpret SQL Transaction Log using sys.fn_dblog

Ever wondered how to read the transaction log for a database? There is an undocumented SQL function sys.fn_dblog which may help you to read T-Log except for the truncated transaction details. We can use this function effectively for point in time recovery at a LSN level.

First lets see how the typical output of the function, I have run the function on the AdventureWorks2012 DB,

select * from sys.fn_dblog(NULL,NULL)

Note:-The 2 parameters for are sys.fn_dblog StartLSN and EndLSN if you want to see the operation between specific LSN range. Default NULL, NULL will read the entire T-Log.


There you go you can see a CurrentLSN Column, Operations Column, TransactionID, PreviousLSN column etc, I am not going to discuss all columns in detail but we will see the use of some of them in our exercise today.

As you can see in the Operations column you can see operation like INSERT(LOP_INSERT_ROWS), Begin transaction(LOP_BEGIN_XACT), CheckpointEnd(LOP_END_CKPT)etc. Lets carry out an example and see how can we interpret these details.

Lets Create a Table and see what happens in the Log,

CREATE TABLE Test (a int)
GO
select [Current LSN],Operation,Context,[Transaction ID],[Previous LSN],[Transaction Name],AllocUnitName,[Begin Time] from sys.fn_dblog(NULL,NULL) ORDER BY [Transaction ID] 


As you can see there is a BEGIN TRAN event(LOP_BEGIN_XACT) with the corresponding Transaction name column as "CREATE TABLE", this is followed by set of INSERT and UPDATE operation(LOP_INSERT_ROWS and LOP_MODIFY_ROW) on various system tables(Refer AllocUnitName Column on the pic) for the new table creation.

Next I insert values to the table,

INSERT INTO Test Values(1)
GO
INSERT INTO Test Values(2)
GO
INSERT INTO Test Values(3)
GO
select [Current LSN],Operation,Context,[Transaction ID],[Previous LSN],[Transaction Name],AllocUnitName,[Begin Time],[End Time] from sys.fn_dblog(NULL,NULL) ORDER BY [Transaction ID]


As you can see we have 3 LOP_BEGIN_XACT,LOP_INSERT_ROWS,LOP_COMMIT_XACT set of operation for the 3 row insert and some page allocation tasks. You can also see we have start time for Begin TRAN and a End Time for the Commit Tran. If you see the Context column for the INSERT operation you can see LCK_HEAP indicating inserting rows to a heap table.

Next I ran UPDATE,

UPDATE Test SET a = 5 where a = 1


As expected you can see LOP_MODIFY_ROW on a LCX_HEAP for the UPDATE statement. Next I ran DELETE,

DELETE from Test where a = 5


 There you go LOP_DELETE_ROWS operation on LCX_HEAP. 

Next I ran,

DROP TABLE Test


As in CREATE Table statement DROP Table has LOP_BEGIN_XACT,LOP_LOCK_XACT operation followed by updating system tables operations and finally Commit operation LOP_COMMIT_XACT.

Finally Lets see how a rollback looks like in the T-Log,

BEGIN TRAN
INSERT INTO Test Values(1)
ROLLBACK


There was a INSERT operation then on Rollback there was a DELETE operation of the inserted row and finally Abort Transaction operation(LOP_ABORT_XACT).

Now that we have seen how we can interpret the sys.fn_dblog output now we can see how we can put it to use, 

For example if an user DELETED multiple row by mistake and does not know what rows he deleted and comes to you for help and want to restore the database to a state exactly before the data deletion. We usually go back to restoring the backups but if you have multiple users using the DB how will you go to the exact state before the DELETE was issues that's where sys.fn_dblog can be very useful. You can just read the out of the Log around the time the delete was issued then note the CurrentLSN on the LOP_BEGIN_XACT operation for the Delete then Restore backup and Transaction log backup with STOPBEFOREMARK as the CurrentLSN on the LOP_BEGIN_XACT operation.

For assumption lets say my LOP_BEGIN_XACT is '0000002c:000000a9:001e' just prefix lsn:0x to the current LSN Value on LOP_BEGIN_XACT  operation in our case it will be lsn:0x0000002c:000000a9:001e.

Now Run RESTORE LOG with STOPBEFOREMARK,

RESTORE LOG [AdventureWorks2012]
FROM DISK = 'H:\DBBkp\Log\AdventureWorks2012_bkp25.trn'
WITH STOPBEFOREMARK = 'lsn:0x0000002c:000000a9:001e',
RECOVERY;

This should exactly get us back to a state exactly before the DELETE statement issued.